

Numlock Awards: 2020 Oscar Predictions
Numlock Awards is your one-stop awards season newsletter, and it’s back! Every week, join Walt Hickey and Michael Domanico as they break down the math behind the Oscars and the best narratives going into film’s biggest night. Today’s edition comes from Walter.
We’re doing a mailbag next weekend, get those questions to awards@numlock.news. If your new, sign up to get this, it’s a low-key award season popup newsletter that will make you smarter about the Oscars.
Let’s get right to this, the Oscars are hours away. If you’re new, read all about exactly how this works here, how the Academy has changed and even feel free to grab the data for yourself here.
Down underneath the predictions is a longer post about what that experimental model I made last year says.
Acting Awards
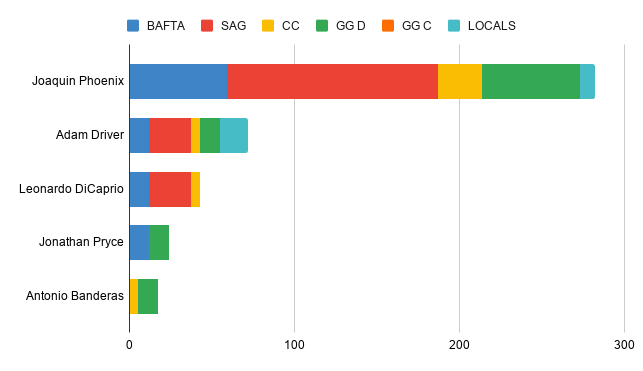
This year, the acting prizes seem about as much sealed deals as they could be, with all four front-runners locking down BAFTA, SAG, and the major critical prizes. It’s still entirely possible one of these has an upset — the Oscars are great and the last thing this project ever wants to do is imply this event is easy to predict — but as far as front-runners go, you couldn’t ask for four more solid ones.
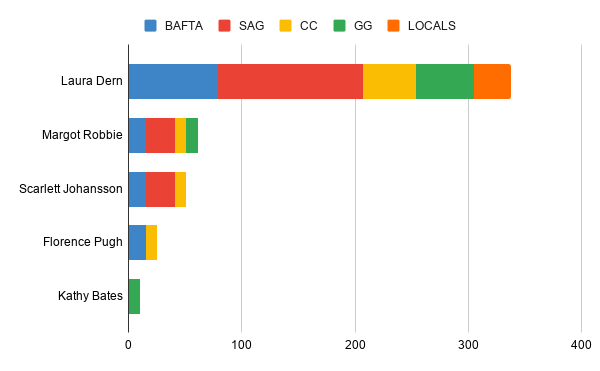
Best Supporting Actress
Best Supporting Actor

Best Actress

Best Actor
Best Director
This early on looked to be a seriously competitive year, with Mendes and Tarantino splitting the historically predictive local wins, and Bong taking most of the local critics’ prizes when ignoring historical predictiveness. But Mendes has slowly swept:

Best Picture
The big one. This one’s a big lead for 1917, that much cannot be ignored.
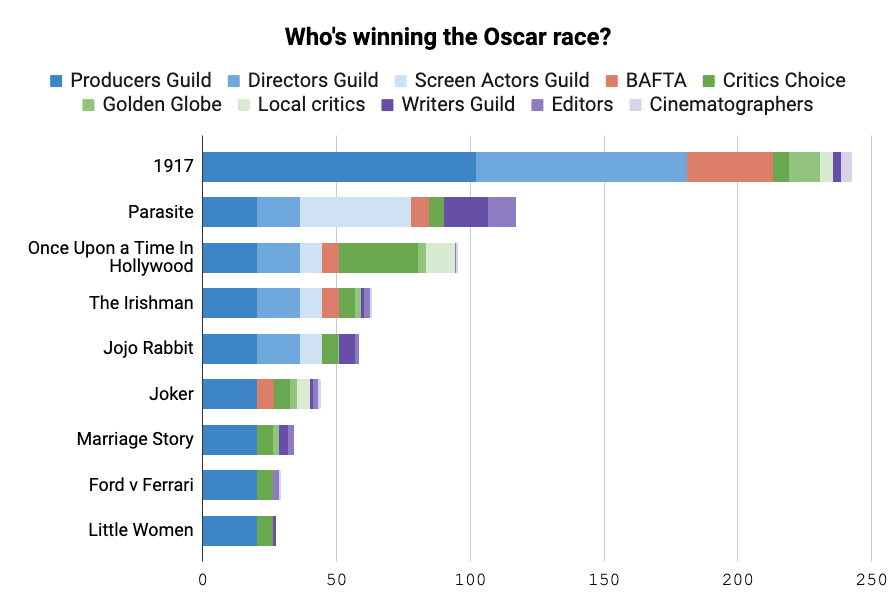
Someone asked in the mailbag what, if anything, I’m looking for this year in terms of the predictive power of precursors, and honestly this couldn’t be a bigger distillation. The Producers Guild is flexing, lately, and I want to know if they’re the real deal or a flash in the pan.
I wrote a whole post on why the Producers Guild is of interest to us, why it might be better than other organizations at picking winners, and I think it’ll be the bellwether for how well the Academy is actually shifting and why.

Is it because the Academy didn’t just let in young people and international producers of film, but rather because they allowed in an abundance of a specific type of person, that is to say “suits” rather than performers or technicians, the type of person whose preferences are best captured by the PGA rather than any of the bona fide guilds? We won’t know for a while, but a 1917 win or loss would be more evidence one way or another.
If you want a counterweight to this, my friend James England produces an exceptional model that uses the same techniques as his college football ranking model to figure out Best Picture front-runners. It’s a really neat one. Like us, he publishes all his data: openness is really important, if you use a black box and pretending it’s quantitative you’re serving absolutely no one but yourself. I come back to it every year because it’s a completely different approach, so it captures different things, and it’s been right when we’re wrong. I think he gets at an under-analyzed way of estimating vote and TL;DR this year he likes Parasite.
And that about wraps it u—
Wait, didn’t you build a program last year to simulate the Academy and actually turn these weights into probabilities?
I did! Here’s what it found this year. Again, take it with a grain of salt (I still consider it fairly experimental) but I’m happy with it: last year, it gave Roma a 60 percent chance, and winner Green Book a 23 percent chance, which I felt pretty good about, a 1-in-4 chance that was higher than a lot of the other forecasts I’d seen.
There will always be variation on this stuff, and mainly I want to use this model to better understand how the Academy comes to its choice (see: Why Best Picture front-runners aren’t locks anymore and Oscar Front-runners and ranked choice voting) rather than pretend I know what’s going to happen.
Here’s how this works. If this is boring, skip to the bullets down below. But this is how the sausage gets made whenever you see predictive models, from weather to politics to sports, so if you’re interested read on.
We want to know how 8,400 people voting on Best Picture might go under the ranked-choice voting system. To do this, we can run a program that simulates 8,400 ballots, with the inputs being our understanding of how much weight the Academy as a whole would lend each candidate. If was doing this for a presidential election, I would have 49% of the weight for the Democrat, 49% for the Republican, 1% for the Libertarian and 1% for the Green. We could then simulate a person’s decision by drawing a random number and then figuring out where they’d land. Instead, we do that for 9 Best Picture nominees, and we do it several times per person (because they submit a ranking, not a single vote) and we do it 8,400 times to simulate the whole Academy.
First a simulation takes the weights that we know — the overall scores for the movies — and then it kind of scuffs them up a bit by adding or subtracting a randomly generated number from each. Remember, we don’t actually know the “true” preferences of the Academy, so this process of randomly adding or subtracting value over 10,000 simulations helps us see how we could be wrong. By directly inducing randomness, we’ll get a better idea of the overall chances movies have.

Next, it simulates a ballot for each of 8,400 voters.
The way we do this is basically like a raffle. Every movie gets the same number of tickets to start, and then we add more tickets in depending on how its scores came out after the “scuffing.” For each voter, we draw a ticket from the raffle, and that movie is put first on their ranking, then we draw another, and so on. This means that the ballots can look really random — voters are weird and not automatons — but the rankings are nevertheless informed by the overall preference of the Academy.
Then, I figure out what won in that simulation.
Then, we repeat that whole process for 9,999 more simulations. We do a new “scuffing” each time, 8,400 new “raffles” each time, the whole shebang. 84,000,000 simulated ballots across 10,000 simulations. It takes like an hour and it makes my 2013 MacBook Air distressingly warm.
After doing that 10,000 times, I count up how many times each movie won. If a movie won 500 simulations out of 10,000 total, I’d say it has a 5 percent chance. Anytime you’ve seen a forecast, it usually involved something like this happening: you feed a program some observational data, the program does a couple thousand simulations, each one randomly messed with in a different way. Then it says how many times it went each way. That’s all there is to it.
Also, I kept track of how often movies were ranked #1. Across the 84,000,000 simulated ballots, 1917 was top ranked on 12.2 percent of ballots, Parasite on 11.6 percent, Once Upon a Time In Hollywood on 11.3 percent, and so on, down to Ford v Ferrari and Little Women with 10.7 percent. You will observe that’s not a huge difference. But it compounds. Here’s the percentage of the 10,000 simulations each movie won:
1917 — won 7,222 of 10,000 tries, implying 72% chance of victory
Parasite — 1,296 of 10,000 tries, implying 13% chance
Once Upon a Time In Hollywood — 552 of 10,000 tries, implying 6% chance
The Irishman — 301 of 10,000 tries, implying 3% chance
Jojo Rabbit — 200 of 10,000 tries, implying 2% chance
Joker — 127 of 10,000 tries, implying 1% chance
Marriage Story — 116 of 10,000 tries, implying 1% chance
Ford v Ferarri — 98 of 10,000 tries, implying 1% chance
Little Women — 88 of 10,000 tries, implying 1% chance
There you have it. 1917 appears to be a stronger contender than Roma was, making the possibility of an upset slightly more remote. But it is possible, so I will be watching.